Median Home Value, 2017
$141,500
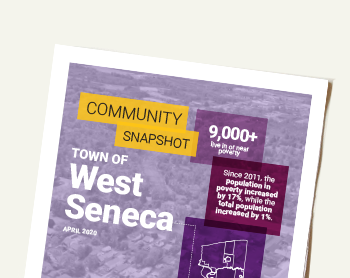
 Residents in West Seneca are less likely to live in or near poverty compared to other communities across the region. But a recent uptick in poverty is a challenge for the town—service providers must support higher levels of need without a growing resource base. An aging population, limited high-paying job options, housing cost burdens, and the need to own a car to get around, all add to the community’s economic needs.
Click here to learn more about what living in or near poverty means for individuals and families.
Vulnerable populations in or near poverty, 2017
Source: American Community Survey.
Source: American Community Survey.
Source: American Community Survey.
Source: American Community Survey.
Source: American Community Survey.
Source: American Community Survey.
| Rank | Employer |
|---|---|
| #1 | West Seneca Central School District |
| #2 | Multisorb Technologies Inc. |
| #3 | Wegmans |
| #4 | Erie 1 BOCES |
| #5 | Union Concrete & Construction Corporation |
| #6 | Certo Brothers Distributing Co. |
| #7 | Tops Friendly Market |
| #8 | Mayer Brothers |
| #9 | Jack Cooper Transport |
| #10 | Home Depot |
Source: Various. See Data Sources and Notes.
| West Seneca | Buffalo-Niagara Metro. Regio | |
|---|---|---|
| Total Jobs | 18,465 | 547,851 |
| Earnings <$15k/yr | 5,553 (30%) |
150,324 (27%) |
| Earnings $15k-$40k/yr | 5,665 (31%) |
178,599 (33%) |
| Earnings >$40/yr | 7,247 (39%) |
218,928 (40%) |
Source: US Census Bureau, LEHD.
$141,500
$780/mo
Over 200 human service providers and leaders use Numbers in Need to find information, build partnerships, pursue funding and advocate for their community.
“This data has been instrumental in finding what our community looks like and what obstacles we need to tackle to move ahead.”
“I have repeatedly and often share this data with colleagues and community members.”