Communities

City of Niagara Falls

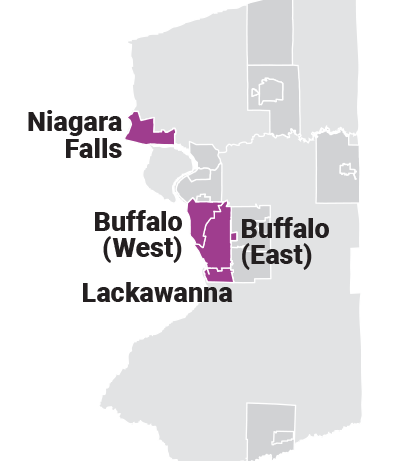
Niagara Falls has some of the highest poverty rates in the region. Poverty is particularly common among children, single parents, and refugees and immigrants. With low graduation rates and a prevalence of lower-paying jobs in the city, young adults are also at risk of poverty. Lower rents and home values make housing more affordable, still 68% of lower-income residents are burdened by housing costs.

*Learn more about what living in or near poverty means for individuals and families.

Population is declining while poverty is rising.

Created with Highcharts 7.2.2Population and Poverty, 2011 and 2017Source: American Community Survey.50,57050,57048,97648,97622,42622,42623,71823,718Total PopulationPopulation In or Near Poverty20112017

Use this slider to view trends over time.

2011
2012
2013
2014
2015
2016
2017

Overall, 44% of residents live in poverty or close to it. The neighborhoods of Hyde Park, Highland, and Downtown are hit hardest.

Population In or Near Poverty

  • 0%–25%
  • 25%–50%
  • 50%–75%
  • 75%–100%
  • Source: American Community Survey

    Maps are meant to show general trends in the proportion of people living in or near poverty. Trends can be affected by many factors, including changes in total population, unemployment, retirement, marriage, divorce, and other changes in family structure. Questions about the maps can be directed to the UB Regional Institute at regional-institute@buffalo.edu.

    Vulnerable populations, % living in poverty, 2017

    More than 40% of all children in Niagara Falls are in poverty—about twice the rate of the region as a whole.

    Source: American Community Survey.

    Created with Highcharts 7.2.243%43%

    Over half of single parents in Niagara Falls live in poverty. This is a higher share than the region as a whole.

    Source: American Community Survey.

    Created with Highcharts 7.2.255%55%

    About one in four young adults live in poverty. Of all the 12 communities, this is the highest poverty rate for young adults.

    Source: American Community Survey.

    Created with Highcharts 7.2.227%27%

    Two-parent families in Niagara Falls are more than twice as likely to live in poverty than the region overall.

    Source: American Community Survey.

    Created with Highcharts 7.2.213%13%

    Almost one in four refugees and immigrants live in poverty. This is on par with the region as a whole.

    Source: American Community Survey.

    Created with Highcharts 7.2.224%24%

    With 367 older adults living in poverty in Niagara Falls, senior poverty rates in the community are on par with the region.

    Source: American Community Survey.

    Created with Highcharts 7.2.211%11%

    WORK AND INCOME

    Six of the top ten employers are tourism related. Many jobs are lower-paying, part-time or seasonal.

    Top 10 Employers, 2019
    Rank Employer
    #1 Seneca Gaming Corp.
    #2 Niagara Falls Memorial Medical Center
    #3 Niagara Falls City School District
    #4 City of Niagara Falls
    #5 Niagara County Social Services
    #6 Walmart Supercenter
    #7 New York State Parks & Rec.
    #8 Sheraton Niagara Falls
    #9 Occidental Chemical Corp
    #10 US Post Office

    Source: Various. See Data Sources and Notes.

    About two thirds of all jobs in the community pay less than $40k per year.

    Jobs by Income Level, 2015
    Niagara Falls Buffalo Niagara
    Total Jobs 18,601 547,851
    Earnings <$15k/yr 5,587 (30%) 150,324
    (27%)
    Earnings $15k-$40k/yr 6,581 (35%) 178,599
    (33%)
    Earnings >$40k/yr 6,433 (35%) 218,928
    (40%)

    Source: American Community Survey.

    Education

    Over half of adults could increase earnings by pursuing education beyond high school.

    Created with Highcharts 7.2.2Educational Attainment and Income, 2017Source: American Community Survey.$18,869$18,869$26,668$26,668$32,931$32,931$36,431$36,431$55,841$55,84112%12%40%40%31%31%10%10%7%7%Median Earnings% of Adults Age 25+ by Educational AttainmentLess than High SchoolHigh School Diploma (orequivalent)Some College or Associate'sDegreeBachelor's DegreeGraduate or Professional Degree

    Graduation rates in Niagara Falls are consistently below the regional average.

    Created with Highcharts 7.2.2Graduation Rates, 2011-2017Source: NYS Education Department.69%69%69%69%65%65%62%62%71%71%66%66%69%69%81%81%79%79%81%81%81%81%84%84%85%85%84%84%Niagara FallsBuffalo Niagara Metro Region2010-112011-122012-132013-142014-152015-162016-17

    Housing

    Housing costs are particularly burdensome for lower-income renters.

    Created with Highcharts 7.2.2Lower-Income Households Paying More than 30% of Household Income on Housing Costs, 2017Source: American Community Survey.54%78%OwnersRenters
    • Niagara Falls’ median home value is low—about half the region.

      Median Home Value, 2017

      $69,900

      Source: American Community Survey
    • Rents in Niagara Falls are lower than the region overall.

      Median Rent, 2017

      $645/mo

      Source: American Community Survey

    Transportation

    Seniors in Niagara Falls are slightly more likely to be without a car.

    Households Without Vehicles, 2017
    • 20%
      UNDER 65 yr
    • 22%
      OVER 65 yr
    Source: Various. See Data Sources and Notes.

    Nine out of ten workers use a car to get to work, but over 3,300 use other modes.

    Created with Highcharts 7.2.2Commute Mode, 2017Source: American Community Survey.82%82%8%8%4%4%3%3%2%2%2%2%1%1%Drive AloneCarpoolWalkPublic TransportationWork from HomeOther TransportationBicycle

    Crime

    Violent crime fell 7% since 2010, but the city has the highest rate of all 12 communities.

    While rates fell 17%, property crimes are more common here than the other 12 communities.

    Created with Highcharts 7.2.2Violent Crime Rate per 100,000, 2010-2017Source: NYS Division of Criminal Justice Services.1,1991,1991,1451,1451,2331,2331,1701,1701,1571,1571,1271,1271,1491,1491,1111,11120102011201220132014201520162017
    Created with Highcharts 7.2.2Property Crime Rate per 100,000, 2010-2017Source: NYS Division of Criminal Justice Services.5,7445,7445,8005,8005,9055,9055,6275,6275,3185,3185,1265,1264,8864,8864,7704,77020102011201220132014201520162017

    Despite high poverty among youth, juvenile arrests fell by more than half since 2013.

    Created with Highcharts 7.2.2Juvenile Arrests, 2013-2017Source: NYS Division of Criminal Justice Services.18818818118195957878828220132014201520162017

    Explore other communities in urban areas in Buffalo Niagara:

    Over 200 human service providers and leaders use Numbers in Need to find information, build partnerships, pursue funding and advocate for their community.

    Tell us how you’re using Numbers in Need

    “This data has been instrumental in finding what our community looks like and what obstacles we need to tackle to move ahead.”

    “I have repeatedly and often share this data with colleagues and community members.”