Median Home Value, 2017
$105,591
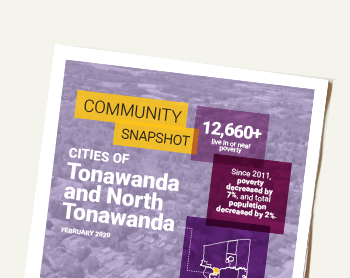
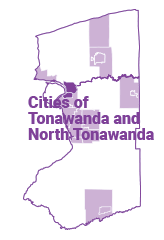 In the Twin Cities of Tonawanda and North Tonawanda, more than 12,600 residents live in or near poverty. Poverty is most concentrated near the Cities’ downtown. A number of services, such as housing, healthcare, and transportation, can address the needs of vulnerable groups like single parents and seniors. Workforce training programs for youth and adults can also remove barriers to help reduce poverty.
Click here to learn more about what living in or near poverty means for individuals and families.
Vulnerable populations, % living in poverty, 2017
Source: American Community Survey.
Source: American Community Survey.
Source: American Community Survey.
Source: American Community Survey.
Source: American Community Survey.
Source: American Community Survey.
| Rank | Employer |
|---|---|
| #1 | DeGraff Memorial Hospital |
| #2 | North Tonawanda City School District |
| #3 | Walmart Supercenter |
| #4 | Live Hose Co. |
| #5 | Tonawanda City School District |
| #6 | Conagra Brands Inc. |
| #7 | NOCO Energy |
| #8 | Kenmore Record-Advertiser |
| #9 | Tops Friendly Market |
| #10 | Livingston International Inc. |
Source: Various. See Data Sources and Notes.
| Twin Cities | Buffalo Niagara | |
|---|---|---|
| Total Jobs | 14,234 | 547,851 |
| <$15k/yr | 4,062 (29%) |
150,324 (27%) |
| $15k-$40k/yr | 5,139 (36%) |
178,599 (33%) |
| >$40k/yr | 5,033 (35%) |
218,928 (40%) |
Source: US Census Bureau, LEHD.
$105,591
$675/month
Over 200 human service providers and leaders use Numbers in Need to find information, build partnerships, pursue funding and advocate for their community.
“This data has been instrumental in finding what our community looks like and what obstacles we need to tackle to move ahead.”
“I have repeatedly and often share this data with colleagues and community members.”