Communities

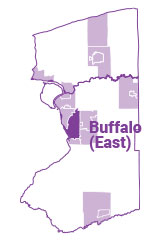
Buffalo (East)

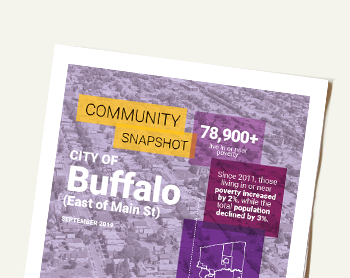
About a quarter of all the individuals in or near poverty in the region live east of Main Street in Buffalo. While improved high school graduation rates and safer neighborhoods strengthen the community, challenges persist. The community has relatively high rental costs, low household incomes, and limited educational attainment.

Click here to learn more about what living in or near poverty means for individuals and families.

As population declines, poverty is on the rise.

Vulnerable populations, % living in poverty, 2017

Over 17,000 children live in poverty. That’s about half of all children in the community.

Source: American Community Survey.

Half of all single parents live in poverty. That’s more than double the rate for two-parent couples with kids.

Source: American Community Survey.

Nearly one in three young adults live in poverty. Young adults need access to jobs and training to increase earnings.

Source: American Community Survey.

One in five two-parent families live in poverty. That’s four times the regional poverty rate for these families.

Source: American Community Survey.

More than a third of refugees and immigrants live in poverty. That’s a higher share than the region as a whole.

Source: American Community Survey.

The poverty rate for seniors east of Main Street in Buffalo is higher than any of the other 12 communities.

Source: American Community Survey.

WORK AND INCOME

Six of the top 10 employers are healthcare providers. These employers offer career pathways to good-paying jobs.

Top 10 Employers, 2019
Rank Employer
#1 Buffalo General Hospital
#2 Roswell Park Comprehensive Cancer Center
#3 Erie County Medical Center
#4 Buffalo City School District
#5 University at Buffalo
#6 Sisters of Charity Hospital
#7 Buffalo VA Medical Center
#8 Mercy Hospital of Buffalo
#9 Niagara Frontier Transportation Authority
#10 Lactalis

Source: Various. See Data Sources and Notes.

Nearly half of all jobs in the community pay more than $40k/yr, a potential asset for residents in the community.

Jobs by Income Level, 2015
Buffalo East Buffalo Niagara
Total Jobs 53,924 547,851
<$15k/yr 10,436
(19%)
150,324
(27%)
$15k-$40k/yr 18,325
(34%)
178,599
(33%)
>$40k/yr 25,163
(47%)
218,928
(40%)

Source: American Community Survey.

Education

Most residents could increase their earnings by advancing their education.

The graduation rate in Buffalo City Schools is on the rise, but still lags behind the region.

Housing

Housing costs are a burden for most lower-income renters—82% spend a third or more of their income on rent.

  • Home values are low, creating opportunities for homeownership.

    Median Home Value, 2017

    $61,588
    Source: American Community Survey
  • Rents are on par with the regional average, but are still too costly for many.

    Median Rent, 2017

    $707/mo

    Source: American Community Survey

Transportation

About one in three households don’t own a vehicle. Seniors are slightly more likely to be without a car.

Households Without Vehicles, 2017
  • 31%
    UNDER 65 yr
  • 33%
    OVER 65 yr
Source: American Community Survey.

A third of workers don’t use a car to get to work. That’s over 18,500 commuters who bike, walk, or take public transit.

Crime

Violent crime rate in the city of Buffalo fell by 26% from 2010 to 2017, but rates are still higher than all but one of the 12 communities.

Property crime rates dropped 32% from 2010 to 2017. Property crime is still more common in Buffalo than in most communities.

Juvenile arrests in the City of Buffalo declined 42% between 2013 and 2017.

Explore other communities in urban areas in Buffalo Niagara:

Over 200 human service providers and leaders use Numbers in Need to find information, build partnerships, pursue funding and advocate for their community.

Tell us how you’re using Numbers in Need

“This data has been instrumental in finding what our community looks like and what obstacles we need to tackle to move ahead.”

“I have repeatedly and often share this data with colleagues and community members.”