Communities

Cheektowaga

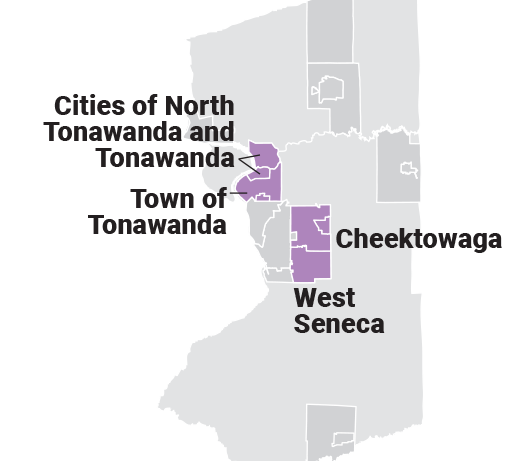
Cheektowaga residents experience poverty at lower rates than the region overall. But as the region’s third largest municipality, Cheektowaga still has many individuals and families in need. Some of the greatest economic threats to community residents are high housing cost burdens, low education levels, limited access to good-paying jobs, and keeping up with the costs of owning a car.

Click here to learn more about what living in or near poverty means for individuals and families.

The total population, as well as those facing poverty, saw modest declines in recent years.

Created with Highcharts 7.2.2Population and Poverty, 2011 and 2017Source: American Community Survey.88,56388,56387,48487,48425,12725,12724,20224,202Total PopulationPopulation In or Near Poverty20112017

Use this slider to view trends over time.

2011
2012
2013
2014
2015
2016
2017

In some neighborhoods near the town's western border, at least half the population lives in or near poverty.

Population In or Near Poverty

  • 0%–25%
  • 25%–50%
  • 50%–75%
  • 75%–100%
  • Source: American Community Survey

    Maps are meant to show general trends in the proportion of people living in or near poverty. Trends can be affected by many factors, including changes in total population, unemployment, retirement, marriage, divorce, and other changes in family structure. Questions about the maps can be directed to the UB Regional Institute at regional-institute@buffalo.edu.

    Vulnerable populations, % living in poverty, 2017

    More than 2,500 children in the town live in poverty. Many are being raised by single parents.

    Source: American Community Survey.

    Created with Highcharts 7.2.217%17%

    Almost a third of all single parents in Cheektowaga live in poverty. That’s about 1,100 families altogether.

    Source: American Community Survey.

    Created with Highcharts 7.2.229%29%

    About one in ten young adults live in poverty and could benefit from higher education or vocational training.

    Source: American Community Survey.

    Created with Highcharts 7.2.29%9%

    Married couples with children are seven times less likely to live in poverty than single parent families.

    Source: American Community Survey.

    Created with Highcharts 7.2.24%4%

    More than 600 refugees and immigrants in Cheektowaga live in poverty.

    Source: American Community Survey.

    Created with Highcharts 7.2.215%15%

    The poverty rate for seniors in the town is on par with the region. Homeowner costs can burden many older adults.

    Source: American Community Survey.

    Created with Highcharts 7.2.29%9%

    WORK AND INCOME

    Cheektowaga’s top 10 employers are in retail, healthcare and manufacturing. Together they make up about 11% of all jobs in the town.

    Top 10 Employers, 2019
    Rank Employer
    #1 Wegmans
    #2 Tops Friendly Markets
    #3 Osmose Utilities Services Inc.
    #4 PCB Piezotronics Inc.
    #5 Walmart Supercenter
    #6 Center-Hospice Palliative Care
    #7 Sodexo
    #8 Buffalo Niagara International Airport
    #9 Derrick Corp
    #10 Cameron Compression Systems

    Source: Various. See Data Sources and Notes.

    With nearly 48,000 jobs, Cheektowaga attracts workers from all over the region. But about two-thirds of jobs here pay less than $40k/yr.

    Jobs by Income Level, 2015
    Cheektowaga Buffalo Niagara
    Total Jobs 47,910 547,851
    Earnings <$15k/yr 15,216
    (32%)
    150,324
    (27%)
    Earnings $15k-$40k/yr 16,009
    (33%)
    178,599
    (33%)
    Earnings >$40k/yr 16,685
    (35%)
    218,928
    (40%)

    Source: US Census Bureau, LEHD.

    Education

    45% of all Cheektowaga adults have no more than a high school diploma. Those with some college education earn at least 20% more.

    Created with Highcharts 7.2.2Educational Attainment and Income, 2017Source: American Community Survey.$20,861$20,861$30,695$30,695$36,761$36,761$45,325$45,325$50,224$50,2248%8%37%37%32%32%14%14%8%8%Median Earnings% of Adults Age 25+ by Educational AttainmentLess than High SchoolHigh School Diploma (orequivalent)Some College or Associate'sDegreeBachelor's DegreeGraduate or Professional Degree

    Graduation rates in Cheektowaga are stable and on par with the regional average.

    Created with Highcharts 7.2.2Graduation Rates, 2011-2017Source: NYS Education Department.82%82%83%83%85%85%86%86%85%85%85%85%86%86%81%81%79%79%81%81%81%81%84%84%85%85%84%84%CheektowagaBuffalo Niagara Metro Region2010-112011-122012-132013-142014-152015-162016-17

    Housing

    The majority of lower-income households are burdened by housing costs. Most are renters.

    Created with Highcharts 7.2.2Lower-Income Households Paying More than 30% of Household Income on Housing Costs, 2017Source: American Community Survey.57%84%OwnersRenters
    • Cheektowaga’s homes are relatively affordable. The median value is $30k less than the region.

      Median Home Value, 2017

      $104,800

      Source: American Community Survey
    • Rents in Cheektowaga are slightly higher than the region overall.

      Median Rent, 2017

      $802/mo

      Source: American Community Survey

    Transportation

    Seniors are more likely to be without a car than younger residents.

    Households Without Vehicles, 2017
    • 8%
      UNDER 65 yr
    • 14%
      OVER 65 yr
    Source: American Community Survey.

    Most workers (94%) use a car to get to work. There’s bus service in town, but less than 700 workers commute by public transit.

    Created with Highcharts 7.2.2Commute Mode, 2017Source: American Community Survey.87%87%7%7%2%2%1%1%2%2%0%0%1%1%Drive AloneCarpoolPublic TransportationWalkWork from HomeBicycleOther Transportation

    Crime

    The violent crime rate went up 23% from 2010 to 2017, but is still lower than the region.

    While property crime is declining, rates are consistently higher than the regional average.

    Created with Highcharts 7.2.2Violent Crime Rate per 100,000, 2010-2017Source: NYS Division of Criminal Justice Services.17417419819819819818018021321321721720720721421420102011201220132014201520162017
    Created with Highcharts 7.2.2Property Crime Rate per 100,000, 2010-2017Source: NYS Division of Criminal Justice Services.3,0913,0913,1093,1093,1963,1963,0563,0563,0683,0682,7042,7042,8802,8802,6242,62420102011201220132014201520162017

    There were half as many juvenile arrests in 2017 than 2013.

    Created with Highcharts 7.2.2Juvenile Arrests, 2013-2017Source: NYS Division of Criminal Justice Services.30730726526519319315115114414420132014201520162017

    Explore other communities in suburban areas in Buffalo Niagara:

    Over 200 human service providers and leaders use Numbers in Need to find information, build partnerships, pursue funding and advocate for their community.

    Tell us how you’re using Numbers in Need

    “This data has been instrumental in finding what our community looks like and what obstacles we need to tackle to move ahead.”

    “I have repeatedly and often share this data with colleagues and community members.”