Communities

Lockport

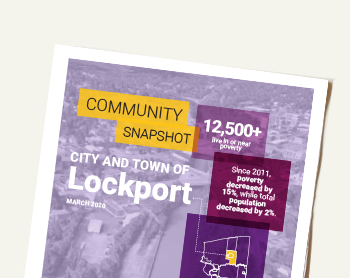
Overall, poverty in Lockport is declining. But poverty is still common for single parents and children. Young adults in Lockport face poverty at a higher rate than the region overall. High school graduation rates are above the regional average, but young adults may be challenged to find good-paying jobs in the community. Other challenges include high housing cost burdens for lower-income families, and the need to have a car to get to to work.

Click here to learn more about what living in or near poverty means for individuals and families.

Lockport’s population declined since 2011, but the number of residents living in or near poverty declined even more.

Created with Highcharts 7.2.2Population and Poverty, 2011 and 2017Source: American Community Survey.41,57041,57040,89840,89813,53613,53612,58712,587Total PopulationPopulation In or Near Poverty20112017

Use this slider to view trends over time.

2011
2012
2013
2014
2015
2016
2017

Residents in or near poverty are more likely to live in the city of Lockport or west of Transit Road in the town.

Population In or Near Poverty

  • 0%–25%
  • 25%–50%
  • 50%–75%
  • 75%–100%
  • Source: American Community Survey

    Maps are meant to show general trends in the proportion of people living in or near poverty. Trends can be affected by many factors, including changes in total population, unemployment, retirement, marriage, divorce, and other changes in family structure. Questions about the maps can be directed to the UB Regional Institute at regional-institute@buffalo.edu.

    Vulnerable populations, % living in poverty, 2017

    13% of all children in Lockport live in poverty. This is less than the poverty rate for young adults.

    Source: American Community Survey.

    Created with Highcharts 7.2.213%13%

    About a third of all single parents live in poverty. This is on par with the region as a whole.

    Source: American Community Survey.

    Created with Highcharts 7.2.233%33%

    About one in five young adults live in poverty. This is a higher share than the region overall.

    Source: American Community Survey.

    Created with Highcharts 7.2.219%19%

    The poverty rate for Lockport’s two-parent families is 4%. This is lower than the regional rate (6%).

    Source: American Community Survey.

    Created with Highcharts 7.2.24%4%

    13% of refugees and immigrants are in poverty—about half the regional poverty rate for this group.

    Source: American Community Survey.

    Created with Highcharts 7.2.213%13%

    Seniors in Lockport are less likely to live in poverty than children and young adults.

    Source: American Community Survey.

    Created with Highcharts 7.2.29%9%

    WORK AND INCOME

    Even with fewer jobs than decades ago, GM is still Lockport’s largest employer. These 10 employers make up about a quarter of all jobs.

    Top 10 Employers, 2019
    Rank Employer
    #1 General Motors
    #2 Eastern Niagara Hospital
    #3 Lockport City School District
    #4 Niagara County Sheriffs Dept.
    #5 Grand Tours & Ridge Road Express
    #6 Walmart Supercenter
    #7 Candlelight Cabinetry Inc.
    #8 Wyndham Lawn Home For Children
    #9 Home Depot
    #10 Odd Fellow-Rebekah Benefit Fund

    Source: Various. See Data Sources and Notes.

    With nearly 17,000 jobs, many that pay more than $40k/year, Lockport is an employment hub for Niagara County.

    Jobs by Income Level, 2015
    Lockport Buffalo Niagara
    Total Jobs 16,784 547,851
    <$15k/yr 4,427
    (26%)
    150,324
    (27%)
    $15-$40k/yr 5,975
    (36%)
    178,599
    (33%)
    >$40k/yr 6,382
    (38%)
    218,928
    (40%)

    Source: US Census Bureau, LEHD.

    Education

    23% of Lockport adults have a bachelor’s degree or more. These residents earn more than those with less education.

    Created with Highcharts 7.2.2Educational Attainment and Income, 2017Source: American Community Survey.22,19522,19532,89132,89134,74734,74746,35646,35659,21459,21410%10%31%31%35%35%14%14%9%9%Median Earnings% of Adults Age 25+ by Educational AttainmentLess than High SchoolHigh School Diploma (orequivalent)Some College or Associate'sDegreeBachelor's DegreeGraduate or Professional Degree

    Graduation rates in Lockport are consistently above the regional average. High school grads earn $10k+/yr more than those who drop out.

    Created with Highcharts 7.2.2Graduation Rates, 2011-2017Source: NYS Education Department.85%85%84%84%83%83%89%89%86%86%87%87%88%88%81%81%79%79%81%81%81%81%84%84%85%85%84%84%LockportBuffalo Niagara Metro Region2010-112011-122012-132013-142014-152015-162016-17

    Housing

    66% of lower-income households are burdened by housing costs. Homeowners are more likely to be cost-burdened.

    Created with Highcharts 7.2.2Lower-Income Households Paying More than 30% of Household Income on Housing Costs, 2017Source: American Community Survey.68%68%64%64%OwnersRenters
    • Home values are 15% lower than the regional average.

      Median Home Value, 2017

      $105,606

      Source: American Community Survey.
    • Monthly rents are also 15% lower than the regional average.

      Median Rent, 2017

      $652/month

      Source: American Community Survey.

    Transportation

    Older residents in Lockport are slightly more likely to be without a vehicle.

    Households Without Vehicles, 2017
    • 8%
      UNDER 65 yr
    • 11%
      OVER 65 yr
    Source: American Community Survey.

    About 93% of workers commute by car, but nearly 1,200 use other modes, like walking.

    Created with Highcharts 7.2.2Commute Mode, 2017Source: American Community Survey.87%87%6%6%2%2%2%2%1%1%0%0%0%0%Drive AloneCarpoolWalkWork from HomeOther TransportationBicyclePublic Transportation

    Crime

    In 2017, Lockport’s violent crime rate hit its lowest point since at least 2010.

    Lockport’s property crime rate decreased by 52% from 2010 to 2017.

    Created with Highcharts 7.2.2Violent Crime Rate per 100,000, 2010-2017Source: NYS Division of Criminal Justice Services.28628632132128428433333335335334534545845827627620102011201220132014201520162017
    Created with Highcharts 7.2.2Property Crime Rate per 100,000, 2010-2017Source: NYS Division of Criminal Justice Services.3,5743,5743,4613,4613,4533,4533,1033,1032,7442,7442,5222,5223,1803,1801,7271,72720102011201220132014201520162017

    There have only been three juvenile arrests in Lockport since 2013.

    Created with Highcharts 7.2.2Juvenile Arrests, 2013-2017Source: NYS Division of Criminal Justice Services.14142200001120132014201520162017

    Explore other communities in rural areas in Buffalo Niagara:

    Over 200 human service providers and leaders use Numbers in Need to find information, build partnerships, pursue funding and advocate for their community.

    Tell us how you’re using Numbers in Need

    “This data has been instrumental in finding what our community looks like and what obstacles we need to tackle to move ahead.”

    “I have repeatedly and often share this data with colleagues and community members.”