Communities

Regional Picture

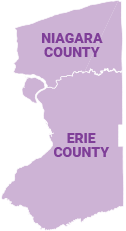
About 338,000 people live in or near poverty in Buffalo Niagara. Poverty is concentrated and most persistent in urban areas. But it’s spreading into rural and suburban areas where access to jobs and services is more limited, especially without a car. Finding ways to increase access to education and training, reduce housing cost burdens, and provide flexible transportation options are universal needs in communities across Buffalo Niagara.

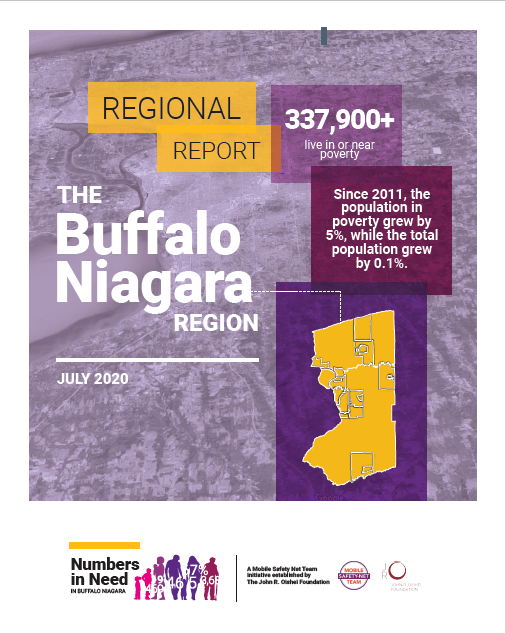
Read more about the regional picture in the Numbers in Need Buffalo Niagara Regional Report which summarizes findings from our 12 community reports and presents strategies, models, and considerations for the future, including the potential ramifications of the COVID-19 pandemic.

About a third of the region’s residents live in or near poverty. From 2011 to 2017, poverty increased more than the total population.

Created with Highcharts 7.2.2Population and Poverty, 2011 and 2017Source: American Community Survey.1,135,7501,135,7501,136,6701,136,670336,754336,754337,975337,975Total PopulationPopulation In or Near Poverty20112017

Use this slider to view trends over time.

2011
2012
2013
2014
2015
2016
2017

Urban areas are hardest hit by poverty. But poverty also persists in many suburban and rural communities.

Population In or Near Poverty

  • 0%–25%
  • 25%–50%
  • 50%–75%
  • 75%–100%
  • Source: American Community Survey

    Maps are meant to show general trends in the proportion of people living in or near poverty. Trends can be affected by many factors, including changes in total population, unemployment, retirement, marriage, divorce, and other changes in family structure. Questions about the maps can be directed to the UB Regional Institute at regional-institute@buffalo.edu.

    Vulnerable populations, % living in poverty, 2017

    50,000 children in the region live in poverty. In some cities, poverty rates for children are double the regional rate.

    Source: American Community Survey.

    Created with Highcharts 7.2.222%22%

    Thousands of single-parent households in the region are economically vulnerable. 36% live in poverty.

    Source: American Community Survey.

    Created with Highcharts 7.2.236%36%

    About 23,000 young adults—who fuel the workforce and are key to the region’s future—live in poverty.

    Source: American Community Survey.

    Created with Highcharts 7.2.215%15%

    Regionwide, two-parent families are six times less likely to be in poverty than single-parent families.

    Source: American Community Survey.

    Created with Highcharts 7.2.26%6%

    25% of the region’s refugees and immigrants are in poverty. Poverty rates are even higher in urban areas.

    Source: American Community Survey.

    Created with Highcharts 7.2.225%25%

    More than 8,000 older individuals in the region live in poverty. This number represents 10% of seniors age 75+.

    Source: American Community Survey.

    Created with Highcharts 7.2.210%10%

    WORK AND INCOME IN BUFFALO NIAGARA

    The region’s top 10 employers provide over 90,000 jobs—about 16% of all jobs in the region.

    Top 10 Employers, 2019
    Rank Employer
    #1 State of New York
    #2 Federal Executive Board
    #3 Kaleida Health
    #4 Catholic Health
    #5 Buffalo City School District
    #6 University at Buffalo
    #7 M&T Bank
    #8 Erie County
    #9 Wegmans Food Markets
    #10 Tops Friendly Markets

    Source: Various. See Data Sources and Notes.

    40% of all jobs in the region pay $40,000 a year or more.

    Jobs by Income Level, 2015
    Buffalo Niagara
    Total Jobs 547,851
    <$15k/yr 150,324
    (27%)
    $15-$40k/yr 178,599
    (33%)
    >$40k/yr 218,928
    (40%)

    Source: US Census Bureau, LEHD.

    Education IN BUFFALO NIAGARA

    Adults with a high school diploma earn nearly $20,000 less than those with a bachelor’s.

    Created with Highcharts 7.2.2Educational Attainment and Income, 2017Source: American Community Survey.$20,404$20,404$30,820$30,820$36,059$36,059$50,365$50,365$61,386$61,3869%9%29%29%31%31%17%17%14%14%Median Earnings% of Adults Age 25+ by Educational AttainmentLess than high school graduateHigh school graduate (includesequivalency)Some college or associate'sdegreeBachelor's degreeGraduate or professional degree

    Graduation rates improved slightly between 2011 and 2017.

    Created with Highcharts 7.2.2Graduation Rates, 2011-2017Source: NYS Education Department.81%81%79%79%81%81%81%81%84%84%85%85%84%84%Buffalo Niagara Metro Region2010-112011-122012-132013-142014-152015-162016-17

    Housing IN BUFFALO NIAGARA

    70% of all lower-income households are burdened by housing costs. Most are renters.

    Created with Highcharts 7.2.2Lower-Income Households Paying More than 30% of Household Income on Housing Costs, 2017Source: American Community Survey.59%59%79%79%OwnersRenters
    • In the 12 communities, home values tend to be lower than the regional median of $135,000.

      Median Home Value, 2017

      $135,000

      Source: American Community Survey
    • Half of the region’s renters pay more than $763/month in rent.

      Median Rent, 2017

      $763/month

      Source: American Community Survey

    Transportation IN BUFFALO NIAGARA

    13% of the region’s households don’t have a vehicle. Older adults are less likely to have a vehicle than younger residents.

    Households Without Vehicles, 2017
    • 11%
      UNDER 65 yr
    • 16%
      OVER 65 yr
    Source: American Community Survey.

    Buffalo Niagara is car dependent. 90% of commuters get to work by car.

    Created with Highcharts 7.2.2Commute Mode, 2017Source: American Community Survey.82%82%8%8%3%3%3%3%3%3%0%0%1%1%Drive AloneCarpoolPublic TransportationWalkWork from HomeBicycleOther Transportation

    Crime IN BUFFALO NIAGARA

    Region-wide, violent crime rates decreased 21% from 2010 to 2017. But in some suburban communities, violent crime went up.

    The region wide property crime rate fell by 28% from 2010 to 2017.

    Created with Highcharts 7.2.2Violent Crime Rate per 100,000 2010-2017Source: NYS Division of Criminal Justice Services.47247244144144444443143141641640240240940937237220102011201220132014201520162017
    Created with Highcharts 7.2.2Property Crime Rate per 100,000 2010-2017Source: NYS Division of Criminal Justice Services.3,0263,0262,9612,9612,9402,9402,7372,7372,6332,6332,4162,4162,4062,4062,1642,16420102011201220132014201520162017

    Juvenile arrests decreased by 37% between 2013 and 2017. The largest cities—Buffalo and Niagara Falls—saw significant declines.

    Created with Highcharts 7.2.2Juvenile Arrests, 2013-2017Source: NYS Division of Criminal Justice Services.1,2211,2211,2371,23799399384484477477420132014201520162017

    Over 200 human service providers and leaders use Numbers in Need to find information, build partnerships, pursue funding and advocate for their community.

    Tell us how you’re using Numbers in Need

    “This data has been instrumental in finding what our community looks like and what obstacles we need to tackle to move ahead.”

    “I have repeatedly and often share this data with colleagues and community members.”